|
|
 |
||||||||||||||||||||||||||||||||||||||||||||||||||||||||||||||||||||||||||||||||||||||||||||||||||||||||||||||||||||||||||||||||||||||||||||||||||||||||||||||||||||||||||||||||||||||||||||||||||||||||||||||||||||||||||||||||||||||||
|
SCHEDULE ASSIGNMENTS Assignment
1 RESULTS
|
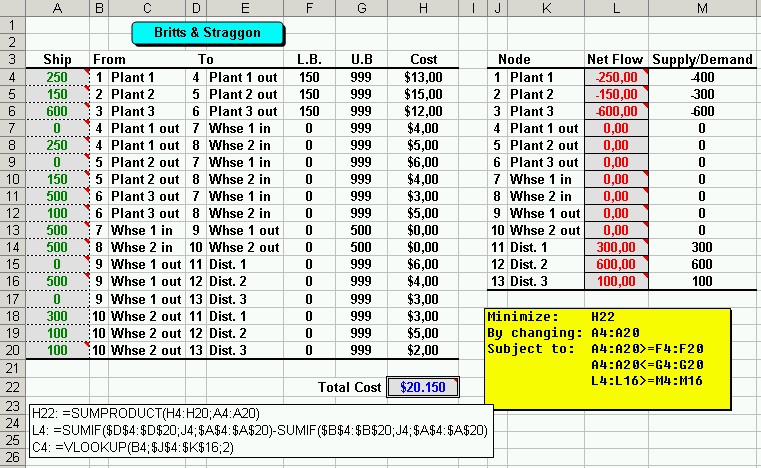
BUS 323 MIDTERM EXAMINATION II Dec. 16, 2003 1. The Britts&Straggon Company manufactures small engines at three different plants. From the plants, the engines are transported to two different warehouse facilities before being distributed to three wholesale distributors. The per unit manufacturing cost at each plant is shown on the table below, in addition to the minimum required and maximum available daily productioncapacities.
The unit cost of transporting engines from each plant to each warehouse is shown below:
The unit cost of shiping engines from each warehouse to each distributor is shown below along with the daily demand for each distributor:
Each warehouse can process up to 500 engines per day. a) Draw a network flow diagram and identify the type of the problem. b) Fill the cells which are marked with “?” on the Excel model shown below. c) Write the formulas in the cells: H22, L4, C4. d) What are the Solver parameters of the model?
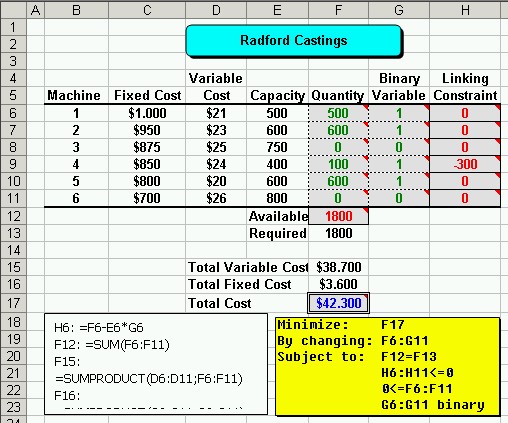
2. Redford Casting can produce brakes on six different machines. The following table summarizes the manufacturing costs associated with producing the brake shoes on each machine along with the available capacity on each machine. If the company has received an order for 1800 brake shoes, how should it schedule these machines?
a) Formulate the problem as an integer programming model. b) Fill the cells which are marked with “?” on the Excel model shown right. c) Write the formulas in the cells: H6, F12, F15, F16. d) What are the Solver parameters of the model?
a) MIN 21X1 + 23X2 + 25X3 + 24X4 + 20X5 + 26X6 + 1000Y1 + 950Y2 + 875Y3 + 850Y4 + 800Y5 + 700Y6 ST X1 + X2 + X3 + X4 + X5 + X6 = 1800 X1 - 500 Y1 £ 0 X2 - 600 Y2 £ 0 X3 - 750 Y3 £ 0 X4 - 400 Y4 £ 0 X5 - 600 Y5 £ 0 X6 - 800 Y6 £ 0 Xi ³ 0 All Yi are binary
3. A national accounting firm has identified the following set of activities that must occur to carry out an audit for one of their major clients.
a) Draw the CPM network (AOA) for the problem. (Use min # of dummy arcs.) b) Identify earliest and latest start times for each activity. c) Identify completion time and the critical path of the project. d) Determine slack times for each activity. 59 DAYS
|